SITCOMTN-146
WET-007: Compare CWFS approaches with WET-001 ComCam data#
Last Verified to Run: 2024-11-08
Software Version:
ts_wep: 12.5.0lsst_distrib: w_2024_45
In this document we compare the wavefront estimation between using TIE and Danish using simulated WET-001 ComCam data. As for LsstCam (see SITCOMTN-144), each extra/intra/in-focus triplet is simulated for 100 random optical states. The defocal offset of R22 is achieved by moving a piston by +/-1.5mm.
Imports#
from lsst.daf import butler as dafButler
import matplotlib.pyplot as plt
from astropy.visualization import ZScaleInterval
from astropy.time import Time
import astropy.units as u
import numpy as np
from lsst.obs.lsst import LsstComCam
from lsst.ts.wep.task.generateDonutDirectDetectTask import (
GenerateDonutDirectDetectTask, GenerateDonutDirectDetectTaskConfig)
from copy import copy
from astropy.visualization import ZScaleInterval
from lsst.ts.wep.task.cutOutDonutsScienceSensorTask import (
CutOutDonutsScienceSensorTask, CutOutDonutsScienceSensorTaskConfig
)
Ingest raws, perform ISR#
Below we ingest the raw simulated data to the central aos_imsim repository. Then we perform the instrument signature removal (ISR):
butler register-instrument /sdf/data/rubin/repo/aos_imsim lsst.obs.lsst.LsstComCam

butler ingest-raws /sdf/data/rubin/repo/aos_imsim/ /sdf/data/rubin/user/gmegias/projects/commissioning_sims/WET-001_comcam/state_*/amp* --update-records -t direct

butler write-curated-calibrations /sdf/data/rubin/repo/aos_imsim  lsst.obs.lsst.LsstComCam

butler define-visits /sdf/data/rubin/repo/aos_imsim   lsst.obs.lsst.LsstComCam
In /sdf/group/rubin/shared/scichris/DM-46763_WET-007, make site_bps.yaml, containing
site:
  s3df:
    profile:
      condor:
        +Walltime: 7200
butlerRootPath = '/sdf/data/rubin/repo/aos_imsim/'
butler = dafButler.Butler(butlerRootPath)
dataRefs = butler.registry.queryDatasets('raw', collections=['LSSTComCam/raw/all'],
                             where=f"instrument='LSSTComCam' and visit.day_obs = 20240723 and exposure.science_program = '1'").expanded()
print(len(list(dataRefs)))
refs = []
for ref in dataRefs:
    refs.append(ref)
2640
We’re short of 9x300 = 2700, because for some optical states not all detectors got simulated.
Run ISR on all states:
cd /sdf/group/rubin/shared/scichris/DM-46763_WET-007

allocateNodes.py -v -n 10 -c 64 -m 60:00:00 -q milano -g 1800 s3df --account rubin:commissioning


description: basic ISR
# Here we specify the corresponding instrument for the data we
# will be using.
instrument: lsst.obs.lsst.LsstComCam
# Then we can specify each task in our pipeline by a name
# and then specify the class name corresponding to that task
tasks:
  isr:
    class: lsst.ip.isr.isrTask.IsrTask
    # Below we specify the configuration settings we want to use
    # when running the task in this pipeline. Since our data doesn't
    # include bias or flats we only want to use doApplyGains and
    # doOverscan in our isr task.
    config:
      connections.outputExposure: 'postISRCCD'
      doBias: False
      doVariance: True
      doLinearize: False
      doCrosstalk: False
      doDefect: False
      doNanMasking: False
      doInterpolate: False
      doBrighterFatter: False
      doDark: False
      doFlat: False
      doApplyGains: True
      doFringe: False
      doOverscan: True
      python: OverscanCorrectionTask.ConfigClass.fitType = 'MEDIAN'


bps submit site_bps.yaml  -b  /sdf/data/rubin/repo/aos_imsim -i  LSSTComCam/raw/all,LSSTComCam/calib/unbounded -o WET-001_lsstComCam_ISR -p /sdf/group/rubin/shared/scichris/DM-46763_WET-007/lsstComCamPipelineISR.yaml  -d "instrument='LSSTComCam' and exposure.science_program = '1'"
collection = 'WET-001_lsstComCam_ISR'
butlerRootPath = '/sdf/data/rubin/repo/aos_imsim/'
butler = dafButler.Butler(butlerRootPath)
dataRefs = butler.registry.queryDatasets('postISRCCD', collections=[collection],
                             where=f"instrument='LSSTComCam' and exposure.day_obs = 20240723").expanded()
print(len(list(dataRefs)))
2640
Find all intra and extra-focal exposure ids corresponding to a particular state:
for ref in list(dataRefs):
    seq_num = int(str(ref.dataId.exposure.seq_num)[1:])

    # for N-th state, the extra states
    # have seqNum of 2N-1,  intra states have 2N
    state = seq_num // 2
    defocus = str(ref.dataId.exposure.seq_num)[0] # 5 for in-focus,  6 for defocal

    raft = ref.dataId.detector.id
    if defocus == '6' and state == 4:
        print(state, seq_num, raft, ref.dataId.exposure.id)
4 9 3 5024072306009
4 9 6 5024072306009
4 8 4 5024072306008
4 9 5 5024072306009
4 8 0 5024072306008
4 9 2 5024072306009
4 8 6 5024072306008
4 8 5 5024072306008
4 8 7 5024072306008
4 8 8 5024072306008
4 9 7 5024072306009
4 9 4 5024072306009
4 8 3 5024072306008
4 8 2 5024072306008
4 9 1 5024072306009
4 8 1 5024072306008
4 9 8 5024072306009
4 9 0 5024072306009
Choosing the maximum number of Zernike terms#
We find that there is a difference in fit results depending on tha maximum number of Zernike terms used. This means we’re fitting Zk4: ZkN. The default N for a long time was Zk22. For imSim the default of OPD header was up to Zk29, which motivated the change in ts_wep defaults, and introduction of maxNollIndex parameter in estimateZernikes. To illustrate the point we run interactive steps of a pipeline for a single detector pair.
First, donut detection and cutouts:
dataIdIntra = {'instrument': 'LSSTComCam', 'detector': 0, 'exposure': 5024072306008, 'day_obs': 20240723, } # 2N
dataIdExtra = {'instrument': 'LSSTComCam', 'detector': 0, 'exposure': 5024072306007, 'day_obs': 20240723, } # 2N-1

collection = 'WET-001_lsstComCam_ISR'
exposureIntra = butler.get('postISRCCD', dataId=dataIdIntra, collections=[collection])
exposureExtra = butler.get('postISRCCD', dataId=dataIdExtra, collections=[collection])
config = GenerateDonutDirectDetectTaskConfig()
config.measurementTask.nSigmaDetection = 5
config.donutSelector.useCustomMagLimit = True

camera = LsstComCam().getCamera()

task = GenerateDonutDirectDetectTask(config=config)
taskOut = task.run(copy(exposureIntra), camera)

# plot the exposure and detected donuts
fig = plt.figure()

d = exposureIntra.image.array
zscale = ZScaleInterval()
vmin,vmax = zscale.get_limits(d)
plt.imshow(d, vmin=vmin, vmax=vmax, origin='lower')
plt.scatter(taskOut.donutCatalog['centroid_x'], taskOut.donutCatalog['centroid_y'],
            marker='+', c='r', label=f'doDonutSelection:{config.doDonutSelection}'
                )
INFO:lsst.generateDonutDirectDetectTask.measurementTask:Found 159 sources in exposure
INFO:lsst.generateDonutDirectDetectTask.measurementTask:Measured 159 of 159 sources in exposure
INFO:lsst.generateDonutDirectDetectTask:Running Donut Selector
INFO:lsst.generateDonutDirectDetectTask.donutSelector:Selected 46/159 references
<matplotlib.collections.PathCollection at 0x7f72b96c7310>
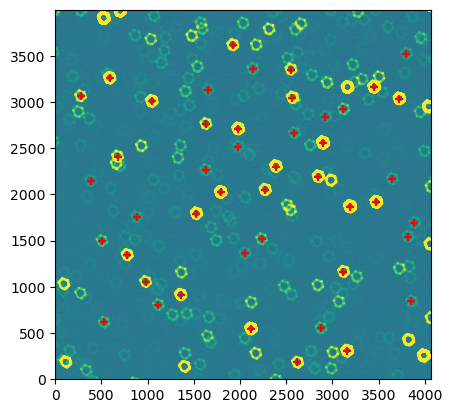
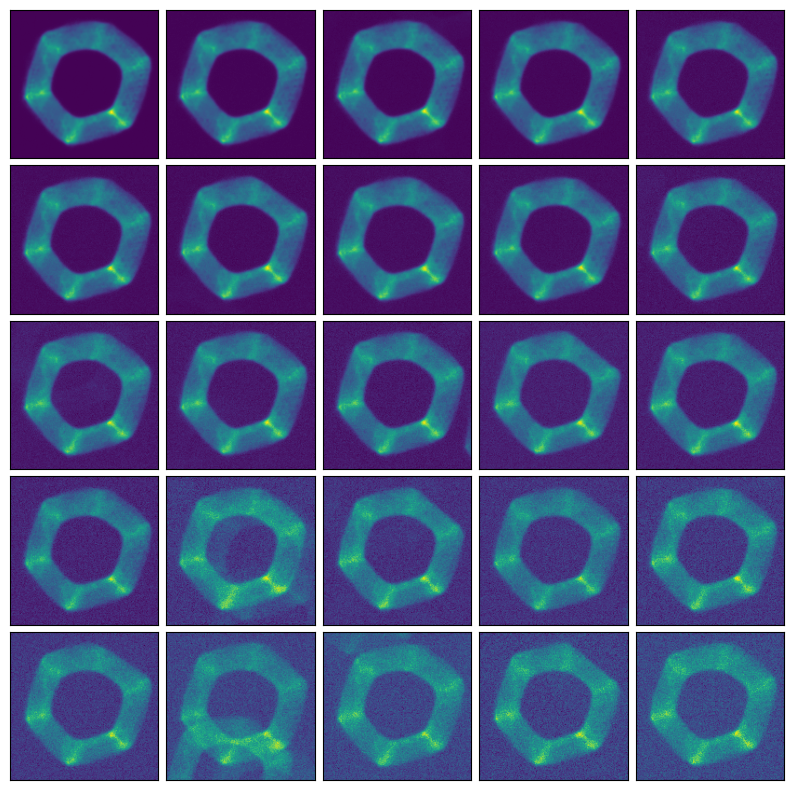
That’s a sufficient number of donuts to compare wavefront retrieval as a function of maxNollIndex. Prepare cutouts:
config = CutOutDonutsScienceSensorTaskConfig()
task = CutOutDonutsScienceSensorTask(config=config)
taskOut = task.run([exposureIntra, exposureExtra],
                   [taskOut.donutCatalog,taskOut.donutCatalog],
                   camera
                  )
INFO:lsst.CutOutDonutsScienceSensorTask:Median Recentering Shift: (3.0, 4.0)
INFO:lsst.CutOutDonutsScienceSensorTask:Median Recentering Shift: (1.0, 1.0)
# illustrate the donuts
fig,axs = plt.subplots(5,5, figsize=(10,10))
ax = np.ravel(axs)
i=0
donutStamps = taskOut.donutStampsExtra
for stamp in donutStamps:
    if i < len(ax):
        ax[i].imshow(stamp.stamp_im.image.array, origin='lower')
        ax[i].set_xticks([])
        ax[i].set_yticks([])
        i += 1
fig.subplots_adjust(hspace=0.05, wspace=0.05)

if len(donutStamps)<len(ax):
    for i in range(len(donutStamps), len(ax)):
        ax[i].axis('off')
# run TIE and Danish fit, store the intermediate results for plotting
from lsst.ts.wep.task.calcZernikesTask import ( CalcZernikesTask, CalcZernikesTaskConfig )
from lsst.ts.wep.task import EstimateZernikesTieTask
from lsst.ts.wep.task import EstimateZernikesDanishTask
state = 4
raft = 0
config = CalcZernikesTaskConfig()
config.estimateZernikes.retarget(EstimateZernikesTieTask)
#config.estimateZernikes.retarget(EstimateZernikesDanishTask)
tieOutput = {}
for maxNoll in range(22,29):
    config.estimateZernikes.maxNollIndex = maxNoll
    task = CalcZernikesTask(config=config)
    taskOut = task.run( donutStampsExtra, donutStampsIntra)
    tieOutput[maxNoll] = taskOut
tieFile  = f'DM-46763_WET-001_lsstComCam_state{state}_det{raft}_tie'
np.save(tieFile, tieOutput)
from lsst.ts.wep.task.calcZernikesTask import ( CalcZernikesTask, CalcZernikesTaskConfig )
from lsst.ts.wep.task import EstimateZernikesTieTask
from lsst.ts.wep.task import EstimateZernikesDanishTask

config = CalcZernikesTaskConfig()
config.estimateZernikes.retarget(EstimateZernikesDanishTask)
danishOutput = {}
for maxNoll in range(22,29):
    config.estimateZernikes.maxNollIndex = maxNoll
    task = CalcZernikesTask(config=config)
    taskOut = task.run( donutStampsExtra, donutStampsIntra)
    danishOutput[maxNoll] = taskOut
danishFile = f'DM-46763_WET-001_lsstComCam_state{state}_det{raft}_danish'
np.save(danishFile, danishOutput)
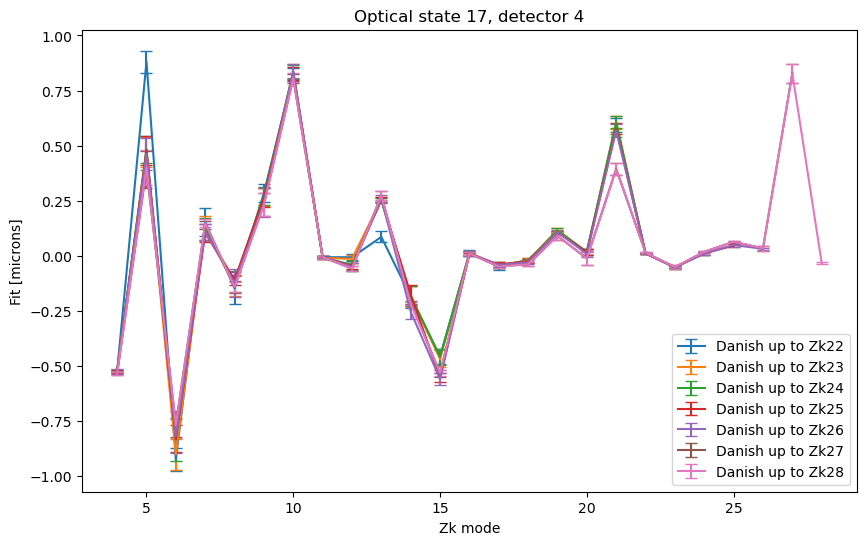
First plot the fit results for Danish - note that the result does not depend much on the maxNollIndex fitted. In the figuere below the errorbars correspond to the standard deviation of the fitted Zernikes.
if os.path.exists(danishFile):
    danishOutput = np.load(danishFile, allow_pickle=True).item()
fig,ax = plt.subplots(1,1,figsize=(10,6))
for maxNoll in range(22,29):
    taskOut = danishOutput[maxNoll]
    zkr = taskOut.outputZernikesRaw
    zka = taskOut.outputZernikesAvg
    zks = taskOut.zernikes
    mask_used = zks['used'][1:]
    zkr_used = zkr[mask_used]
    ax.errorbar(np.arange(4, maxNoll+1), zka[0], yerr=np.std(zkr_used, axis=0), label=f"Danish up to Zk{maxNoll}", capsize=4)


ax.set_xlabel('Zk mode')
ax.set_ylabel('Fit [microns]')
ax.set_title(f'Optical state {state}, detector {raft}')
ax.legend()
<matplotlib.legend.Legend at 0x7f7295290090>
For TIE the situation is vastly different - we obtain similar results only up to maxNollIndex of 26.
if os.path.exists(tieFile):
    tieOutput = np.load(tieFile, allow_pickle=True).item()
fig,ax = plt.subplots(1,1,figsize=(10,6))
for maxNoll in range(22,27):# tieOutput.keys():
    taskOut = tieOutput[maxNoll]
    zkr = taskOut.outputZernikesRaw
    zka = taskOut.outputZernikesAvg
    zks = taskOut.zernikes
    mask_used = zks['used'][1:]
    zkr_used = zkr[mask_used]

    ax.errorbar(np.arange(4, maxNoll+1), zka[0],
                yerr=np.std(zkr_used, axis=0),
                label=f"TIE up to Zk{maxNoll}", capsize=4)

ax.set_xlabel('Zk mode')
ax.set_ylabel('Fit [microns]')
ax.set_title(f'Optical state {state}, detector {raft}')
ax.legend()
<matplotlib.legend.Legend at 0x7f7295060090>
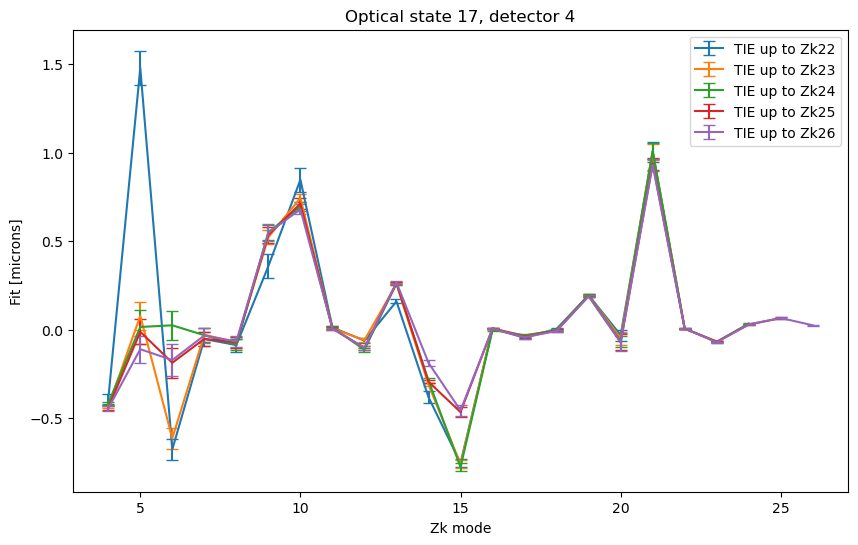
For maxNollIndex between 27-29, the situation becomes more unconstrained. In both plots we include the results with maxNollIndex set to 26 for reference:
fig,ax = plt.subplots(1,1,figsize=(10,6))
for maxNoll in range(26,29):
    taskOut = tieOutput[maxNoll]
    zkr = taskOut.outputZernikesRaw
    zka = taskOut.outputZernikesAvg
    zks = taskOut.zernikes
    mask_used = zks['used'][1:]
    zkr_used = zkr[mask_used]
    ax.errorbar(np.arange(4, maxNoll+1), zka[0],
                yerr=np.std(zkr_used, axis=0),
                label=f"TIE up to Zk{maxNoll}", capsize=4)

ax.set_xlabel('Zk mode')
ax.set_ylabel('Fit [microns]')
ax.set_title(f'Optical state {state}, detector {raft}')
ax.legend()
<matplotlib.legend.Legend at 0x7f7294ef2410>
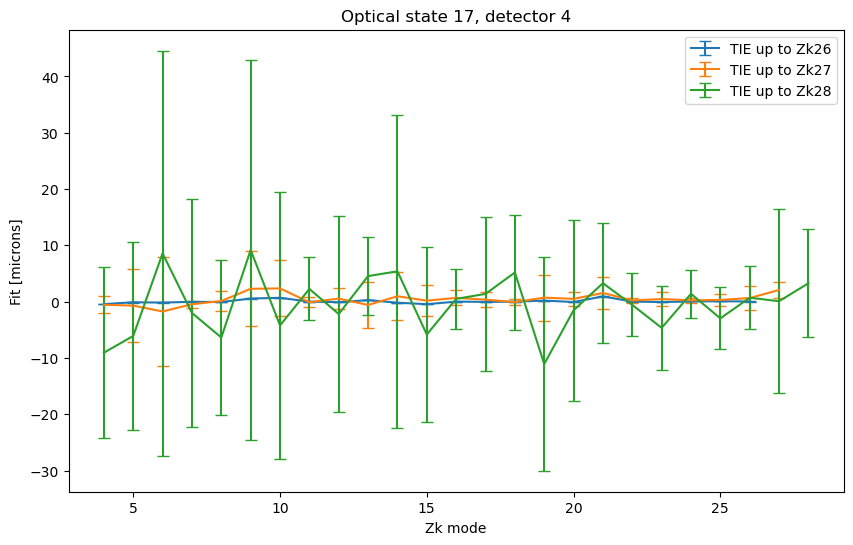
Given that, we run WEP pipeline with maxNollIndex set to 29 (current default) and to 22 (previous default), especially given how it affects the fit results.
Run the WEP pipeline with bps#
To run the wavefront estimation pipeline (WEP), we use the following pipelines yamls:
TIE pipeline (
lsstComCamPipelineDonutsZernikesTIE.yaml)description: run pipeline from ISR to Zk with TIE # Here we specify the corresponding instrument for the data we # will be using. instrument: lsst.obs.lsst.LsstComCam # Then we can specify each task in our pipeline by a name # and then specify the class name corresponding to that task tasks: generateDonutDirectDetectTask: class: lsst.ts.wep.task.generateDonutDirectDetectTask.GenerateDonutDirectDetectTask config: donutSelector.useCustomMagLimit: True measurementTask.nSigmaDetection: 5 cutOutDonutsScienceSensorGroupTask:: class: lsst.ts.wep.task.cutOutDonutsScienceSensorTask.CutOutDonutsScienceSensorTask calcZernikesTask: class: lsst.ts.wep.task.calcZernikesTask.CalcZernikesTask config: estimateZernikes.maxNollIndex: 29Danish pipeline (
lsstComCamPipelineDonutsZernikesDanish.yaml):description: run pipeline from ISR to Zk with Danish # Here we specify the corresponding instrument for the data we # will be using. instrument: lsst.obs.lsst.LsstComCam # Then we can specify each task in our pipeline by a name # and then specify the class name corresponding to that task tasks: generateDonutDirectDetectTask: class: lsst.ts.wep.task.generateDonutDirectDetectTask.GenerateDonutDirectDetectTask config: donutSelector.useCustomMagLimit: True measurementTask.nSigmaDetection: 5 cutOutDonutsScienceSensorTask:: class: lsst.ts.wep.task.cutOutDonutsScienceSensorTask.CutOutDonutsScienceSensorTask calcZernikesTask: class: lsst.ts.wep.task.calcZernikesTask.CalcZernikesTask config: estimateZernikes.maxNollIndex: 29 python: | from lsst.ts.wep.task import EstimateZernikesTieTask, EstimateZernikesDanishTask config.estimateZernikes.retarget(EstimateZernikesDanishTask)
They are run with the following commands:
cd /sdf/group/rubin/shared/scichris/DM-46763_WET-007/
allocateNodes.py -v -n 10 -c 64 -m 60:00:00 -q milano -g 1800 s3df --account rubin:commissioning


bps submit site_bps.yaml  -b  /sdf/data/rubin/repo/aos_imsim/ -i WET-001_lsstComCam_ISR,LSSTComCam/calib/unbounded -o WET-001_lsstComCam_TIE_6001_6200_bps  -p /sdf/group/rubin/shared/scichris/DM-46763_WET-007/lsstComCamPipelineDonutsZernikesTIE.yaml -d "instrument='LSSTComCam' and exposure.day_obs = 20240723"

bps submit site_bps.yaml  -b  /sdf/data/rubin/repo/aos_imsim/ -i WET-001_lsstComCam_ISR,LSSTComCam/calib/unbounded -o WET-001_lsstComCam_Danish_6001_6200_bps  -p /sdf/group/rubin/shared/scichris/DM-46763_WET-007/lsstComCamPipelineDonutsZernikesDanish.yaml -d "instrument='LSSTComCam' and exposure.day_obs = 20240723"
Also, exchanging estimateZernikes.maxNollIndex to 22 we run as:
bps submit site_bps.yaml  -b  /sdf/data/rubin/repo/aos_imsim/ -i WET-001_lsstComCam_ISR,LSSTComCam/calib/unbounded -o WET-001_lsstComCam_TIE_6001_6200_bps_zk22  -p /sdf/group/rubin/shared/scichris/DM-46763_WET-007/lsstComCamPipelineDonutsZernikesTIE.yaml -d "instrument='LSSTComCam' and exposure.day_obs = 20240723"

bps submit site_bps.yaml  -b  /sdf/data/rubin/repo/aos_imsim/ -i WET-001_lsstComCam_ISR,LSSTComCam/calib/unbounded -o WET-001_lsstComCam_Danish_6001_6200_bps_zk22  -p /sdf/group/rubin/shared/scichris/DM-46763_WET-007/lsstComCamPipelineDonutsZernikesDanish.yaml -d "instrument='LSSTComCam' and exposure.day_obs = 20240723"
Inspect the differences in runtime#
To compare runtime we read the information stored in task_metadata, and task_log dataset types:
def calcTaskRuntime(metadata):
    t1 = Time(metadata['quantum']['prepUtc'].split('+')[0], format='isot', scale='utc')
    t2 = Time(metadata['quantum']['endUtc'].split('+')[0], format='isot', scale='utc')
    return (t2-t1).to_value(u.second)
butlerRootPath = '/sdf/data/rubin/repo/aos_imsim/'
butler = dafButler.Butler(butlerRootPath)
registry = butler.registry
results_timing = {}

for maxNollIndex in  [22, 29]:

    coll = '_zk22' if maxNollIndex == 22 else ''
    fname = f'DM-46763_WET-001_lsstComCam_tie_danish_maxNollIndex_{maxNollIndex}_timing.npy'
    if os.path.exists(fname):
        results_timing[maxNollIndex] =  np.load( fname, allow_pickle=True).item()
        print(f'Reading from {fname}')
    else:
        results = {'tie':{}, 'danish':{}}
        for method in results.keys():
            coll_method = 'TIE' if method == 'tie' else 'Danish'
            results[method] = {'generateTime':[], 'Nobj':[],  'cutoutTime':  [],  'cwfsTime':[] }
            output_collection = f'WET-001_lsstComCam_{coll_method}_6001_6200_bps{coll}'

            # get the available refs
            datasetRefs = list(registry.queryDatasets('zernikeEstimateAvg', collections=[output_collection],
                                                 ).expanded())

            for ref in datasetRefs:

                # generating donut catalog
                meta = butler.get('generateDonutDirectDetectTask_metadata', dataId=ref.dataId, collections=[output_collection])
                results[method]['generateTime'].append(calcTaskRuntime(meta))

                # Message like : ['Measured', '135', 'of', '135', 'sources', 'in', 'exposure']
                log = butler.get('generateDonutDirectDetectTask_log', dataId=ref.dataId, collections=[output_collection])
                measuredSources = int(log[-4].message.split(' ')[1])
                results[method]['Nobj'].append(measuredSources)

                # Estimation
                meta = butler.get('calcZernikesTask_metadata', dataId=ref.dataId, collections=[output_collection])
                results[method]['cwfsTime'].append(calcTaskRuntime(meta))
        results_timing[maxNollIndex] = results
        print(f'Saving  as {fname}')
        np.save(fname, results, )
Reading from DM-46763_WET-001_lsstComCam_tie_danish_maxNollIndex_22_timing.npy
Reading from DM-46763_WET-001_lsstComCam_tie_danish_maxNollIndex_29_timing.npy
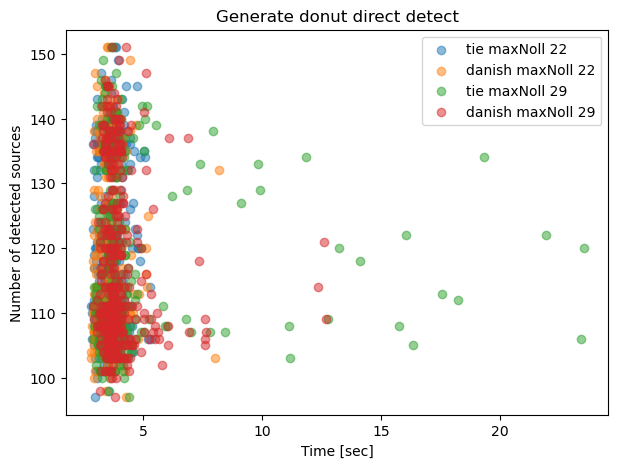
Plot the donut detection as a function of N sources reported. The generation of sources should be largely independent of the CWFS algorithm choice - small differences are expected dure to CPU load, file I/O, and other factors making each runtime unique.
fig,ax = plt.subplots(1,1,figsize=(7,5))
for maxNollIndex in  [22, 29]:
    results =  results_timing[maxNollIndex]
    for method in results.keys():
        ax.scatter(results[method]['generateTime'], results[method]['Nobj'], label=f'{method} maxNoll {maxNollIndex}',
                  alpha=0.5)
ax.legend()
ax.set_xlabel('Time [sec]')
ax.set_ylabel('Number of detected sources')
ax.set_title('Generate donut direct detect')
Text(0.5, 1.0, 'Generate donut direct detect')
However, in case of Zernike estimation we expect the TIE algorithm to be faster than Danish:
fig,ax = plt.subplots(1,1,figsize=(7,5))
for maxNollIndex in  [22, 29]:
    results =  results_timing[maxNollIndex]
    for method in results.keys():
        ax.scatter(results[method]['cwfsTime'], results[method]['Nobj'], label=f'{method} maxNoll {maxNollIndex}',
                  alpha=0.5)
ax.legend()
ax.set_xlabel('Time [sec]')
ax.set_ylabel('Number of detected sources')
ax.set_title('Calculate Zernikes: \nruntime per detector')
Text(0.5, 1.0, 'Calculate Zernikes: \nruntime per detector')
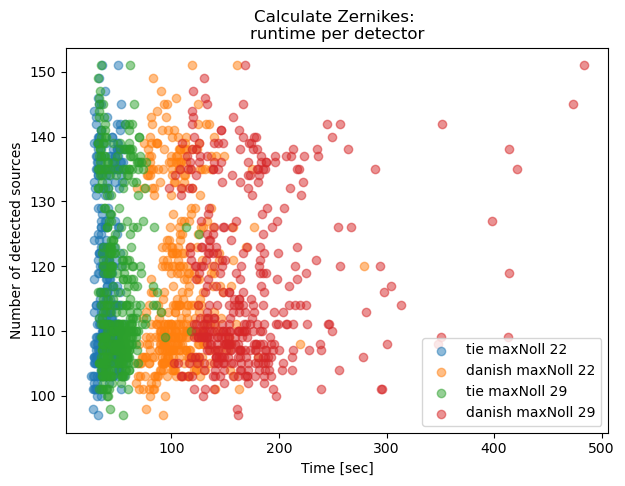
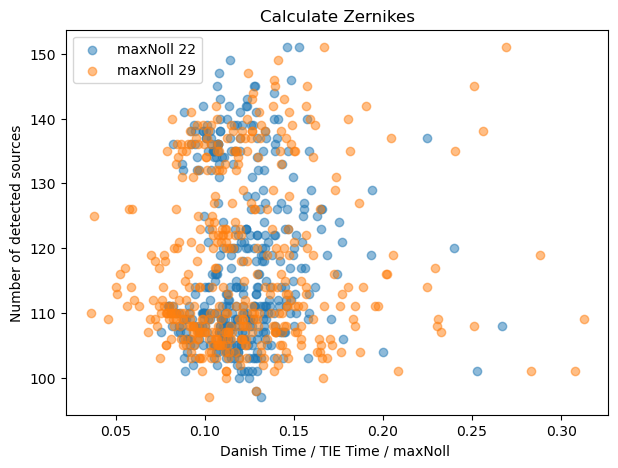
Given that maxNoll 29 implies we are fitting 7 additional Zernike modes, we can account for that by dividing the runtime by the number of fitted Zernikes:
fig,ax = plt.subplots(1,1,figsize=(7,5))
for maxNollIndex in  [22, 29]:
    results =  results_timing[maxNollIndex]
    for method in results.keys():
        ax.scatter(np.array(results[method]['cwfsTime']) / maxNollIndex, results[method]['Nobj'], label=f'{method} maxNoll {maxNollIndex}',
                  alpha=0.5)
ax.legend()
ax.set_xlabel('Time [sec] / Zk mode')
ax.set_ylabel('Number of detected sources')
ax.set_title('Calculate Zernikes: \nruntime per detector per mode')
Text(0.5, 1.0, 'Calculate Zernikes: \nruntime per detector per mode')
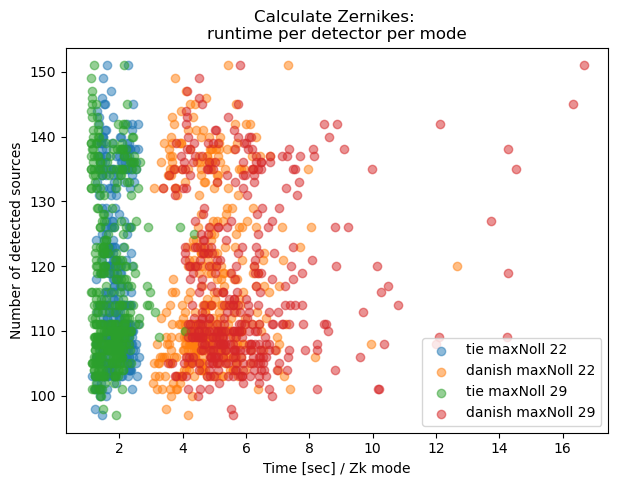
Thus accounting for the number of Zernike modes fitted, TIE takes about 2 seconds per mode, whereas Danish 3-6 seconds.
We can also express the TIE / Danish difference in terms of a ratio of runtimes between two methods for a given maxNoll index:
fig,ax = plt.subplots(1,1,figsize=(7,5))
for maxNollIndex in  [22, 29]:
    results =  results_timing[maxNollIndex]
    ratio = np.array(results['danish']['cwfsTime'])/ np.array(results['tie']['cwfsTime'])
    ax.scatter(ratio, results[method]['Nobj'], label=f'maxNoll {maxNollIndex}',
                  alpha=0.5)
ax.legend()
ax.set_xlabel('Danish Time / TIE Time ')
ax.set_ylabel('Number of detected sources')
ax.set_title('Calculate Zernikes')
Text(0.5, 1.0, 'Calculate Zernikes')
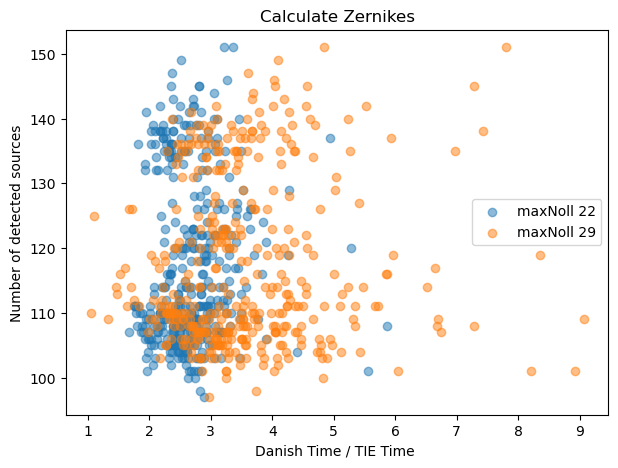
This illustrates that as of writing, Danish is between 2-3 times slower than TIE for maxNollIndex of 22, but 3-5 times slower for maxNollIndex of 29. As above, if we perform per-mode ‘normalization’:
fig,ax = plt.subplots(1,1,figsize=(7,5))
for maxNollIndex in  [22, 29]:
    results =  results_timing[maxNollIndex]
    ratio = np.array(results['danish']['cwfsTime'])/ np.array(results['tie']['cwfsTime'])
    ax.scatter(ratio / maxNollIndex, results[method]['Nobj'], label=f'maxNoll {maxNollIndex}',
                  alpha=0.5)
ax.legend()
ax.set_xlabel('Danish Time / TIE Time / maxNoll ')
ax.set_ylabel('Number of detected sources')
ax.set_title('Calculate Zernikes')
Text(0.5, 1.0, 'Calculate Zernikes')
Inspect the WEP fit results between Danish and TIE#
Now to compare the actual fit results, we read all the results for Danish and TIE:
# store all Danish vs TIE in a dictionary
butlerRootPath = '/sdf/data/rubin/repo/aos_imsim/'
butler = dafButler.Butler(butlerRootPath)
registry = butler.registry
results_stored = {}
for maxNollIndex in  [22,29]:

    coll = '_zk22' if maxNollIndex == 22 else ''
    fname = f'DM-46763_WET-001_lsstComCam_tie_danish_maxNollIndex_{maxNollIndex}.npy'
    if os.path.exists(fname):
        results_stored[maxNollIndex] =  np.load( fname, allow_pickle=True).item()
        print(f'Reading from {fname}')
    else:
        results = {'tie':{}, 'danish':{}}
        for method in results.keys():
            coll_method = 'TIE' if method == 'tie' else 'Danish'
            results[method] = {}
            output_collection = f'WET-001_lsstComCam_{coll_method}_6001_6200_bps{coll}'

            # get the available refs
            datasetRefs = list(registry.queryDatasets('zernikeEstimateAvg', collections=[output_collection],
                                             ).expanded())
            seqs = np.array([int(str(ref.dataId.visit.seq_num)[1:]) for ref in datasetRefs])
            states = np.unique(np.array((seqs+1) / 2).astype(int) )
            for state in states:
                results[method][state] = {}
                for raft in range(9):
                    results[method][state][raft] = {}

            for ref in datasetRefs:
            # read in the results of each method

                seq_num = int(str(ref.dataId.visit.seq_num)[1:])
                state = int((seq_num+1)/2)
                raft = ref.dataId.detector.id
                results[method][state][raft]['zernikeEstimateAvg'] =  butler.get('zernikeEstimateAvg',
                                  dataId=ref.dataId,
                                  collections=[output_collection])
                results[method][state][raft]['zernikeEstimateRaw'] =  butler.get('zernikeEstimateRaw',
                                  dataId=ref.dataId,
                                  collections=[output_collection])
                results[method][state][raft]['zernikes'] =  butler.get('zernikes',
                                  dataId=ref.dataId,
                                  collections=[output_collection])

                results[method][state][raft]['dataId'] = ref.dataId
        results_stored[maxNollIndex] = results
        print(f'Saving {fname}')
        np.save(fname, results, )
Reading from DM-46763_WET-001_lsstComCam_tie_danish_maxNollIndex_22.npy
Reading from DM-46763_WET-001_lsstComCam_tie_danish_maxNollIndex_29.npy
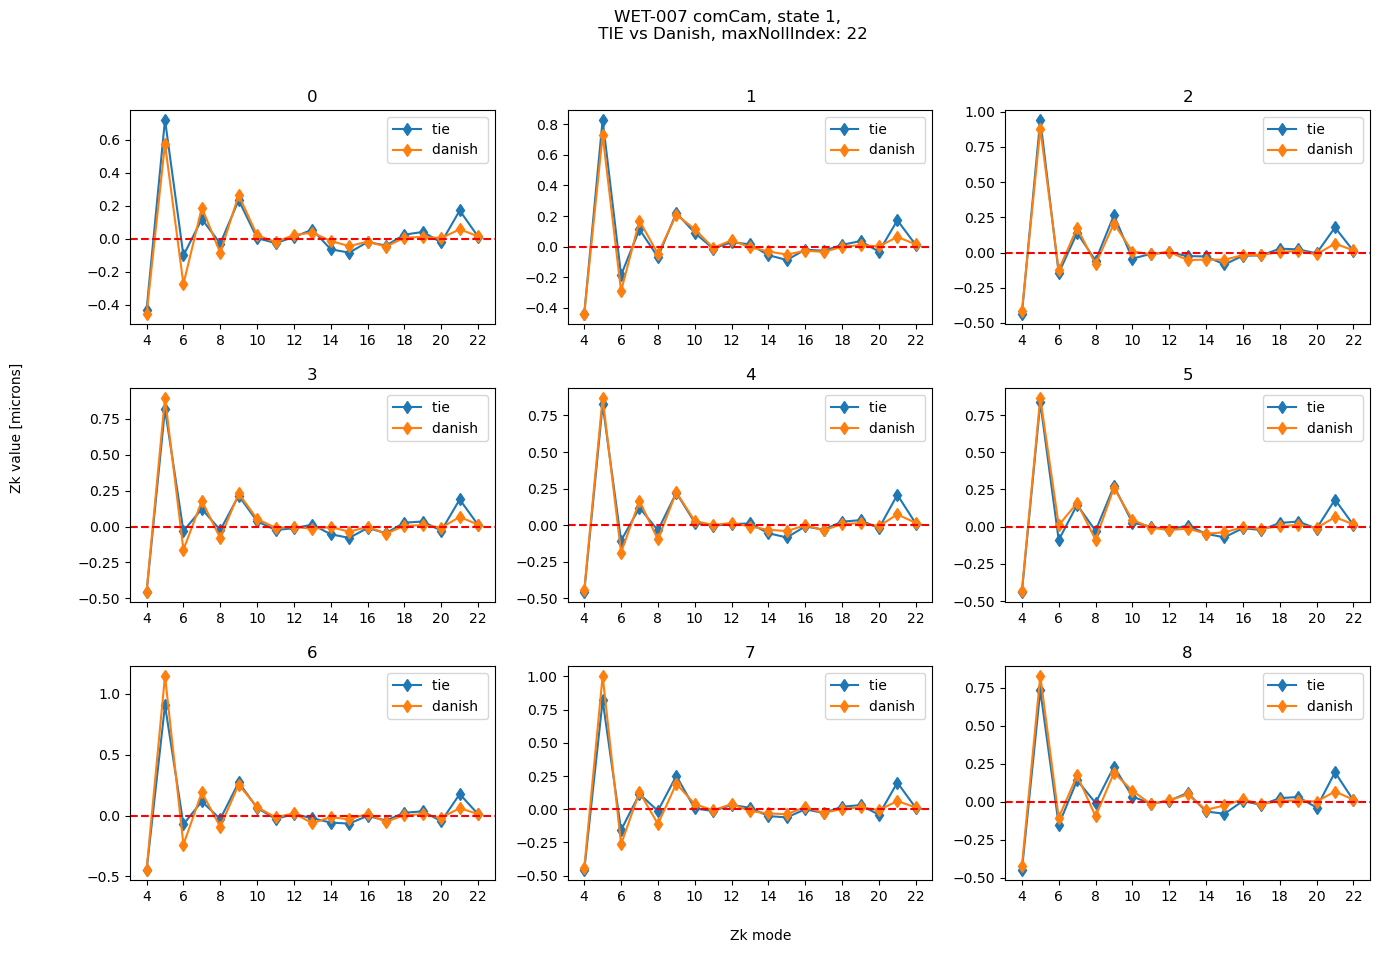
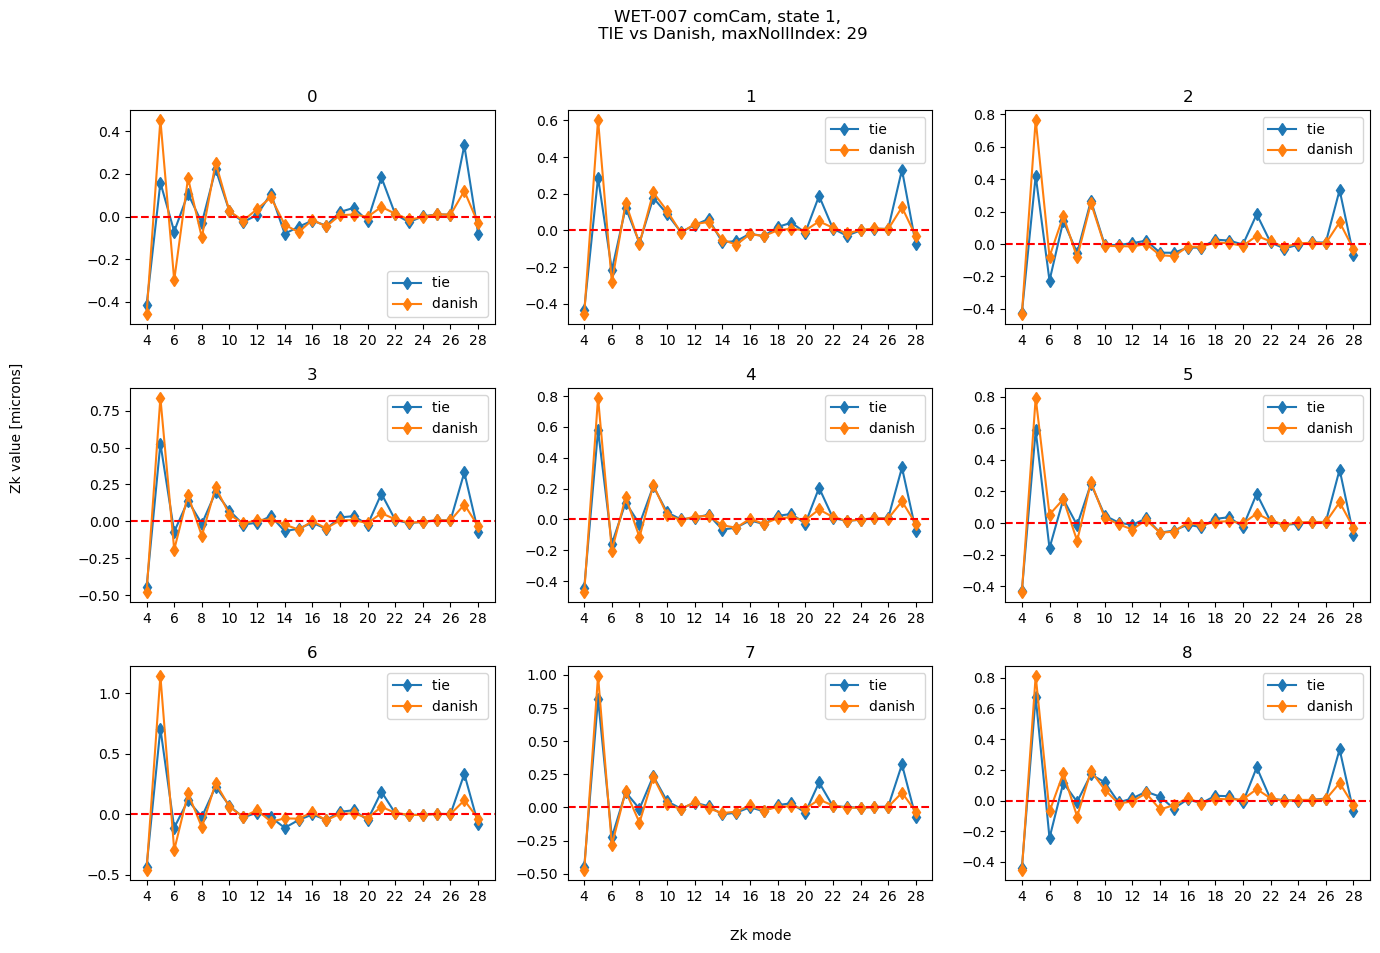
To compare TIE vs Danish, we first plot the actual fit results for each detector for a single optical state:
def plot_fit(state, results, title=''):
    fig,axs = plt.subplots(3,3,figsize=(16,10))
    ax = np.ravel(axs)

    # this plots  just the pairing results
    colors = {'danish':'green',  'tie':'orange'}
    for i in range(9):

        ax[i].set_title(i)
        detId = i
        for method in results.keys():
            # plot  averaged zks for danish and tie
            zkAvg = results[method][state][detId]['zernikeEstimateAvg'][0]
            minNoll = 4
            maxNoll = minNoll + len(zkAvg)
            ax[i].plot(np.arange(minNoll,maxNoll), zkAvg, marker='d', label=f'{method} ')

        ax[i].set_xticks(np.arange(minNoll,maxNoll,step=2))
        ax[i].axhline(0,ls='--', c='red')
        ax[i].legend()

    fig.text(0.5,0.05, 'Zk mode')
    fig.text(0.05,0.5, 'Zk value [microns]', rotation='vertical')
    fig.subplots_adjust(hspace=0.3)
    if title == '' :
      title = f'WET-007 comCam, state {state}, \n : TIE vs Danish'
    fig.suptitle(title)
Compare all detectors for a single simulated optical state#
state=1
maxNollIndex=22
plot_fit(state, results_stored[maxNollIndex], title=f'WET-007 comCam, state {state}, \n TIE vs Danish, maxNollIndex: {maxNollIndex}')
state=1
maxNollIndex=29
plot_fit(state,  results_stored[maxNollIndex], title=f'WET-007 comCam, state {state}, \n TIE vs Danish, maxNollIndex: {maxNollIndex}')
Add information about the uncertainty in Zernike estimation. This could be either:
standard deviation of raw Zernike estimates per detector that went into per-detector average (sample N = number of donut pairs in each detector)
standard deviation of averaged Zernikes across all detectors (sample N=9, corresponding to the number of detectors)
Illustrate both methods. In the figure below the left panel shows the average result with solid green line, and the individual estimates per donut pair in light gray. The errorbars correspond here to the standard deviation of the scatter per mode. The right panel illustrates the average across all detectors, and uncertainty is the scatter in those estimates.
method = 'danish'
state = 4
raft = 8
maxNollIndex = 22
zkr =  results_stored[maxNollIndex][method][state][raft]['zernikeEstimateRaw']
zka =  results_stored[maxNollIndex][method][state][raft]['zernikeEstimateAvg'][0]
zks =  results_stored[maxNollIndex][method][state][raft]['zernikes']

mask_used = zks['used'][1:]
zkr_used = zkr[mask_used]


zka_dets = []
for det in range(9):
    zka_dets.append( results_stored[maxNollIndex][method][state][det]['zernikeEstimateAvg'][0])

minNoll = 4
maxNoll = minNoll + len(zka)

fig,ax = plt.subplots(1,2,figsize=(16,5))
ax[0].plot(np.arange(minNoll, maxNoll), zka)
Npts = len(zkr)
ax[0].errorbar(np.arange(minNoll, maxNoll), zka, yerr=np.std(zkr_used, axis=0), ls="--", c="C2",
               label=f"mean per detector, N={Npts}", capsize=4)
for i in range(len(zkr_used)):
    ax[0].plot(np.arange(minNoll, maxNoll), zkr_used[i], alpha=0.2,c='grey')
ax[0].set_xlabel('Zk mode')
ax[0].set_ylabel('Fit [microns]')
ax[0].set_title(f'Optical state {state}, variation within detector {raft}, {method}')
ax[0].legend()
Npts = len(zka_dets)
ax[1].errorbar(np.arange(minNoll, maxNoll),
               np.mean(zka_dets, axis=0),
               yerr=np.std(zka_dets, axis=0),
               ls="--", c="C2", label=f"mean across detectors, N={Npts}", capsize=4)
for i in range(len(zka_dets)):
    ax[1].plot(np.arange(minNoll, maxNoll), zka_dets[i], alpha=0.2,c='grey')
ax[1].set_title(f'Optical state {state}, variation between detectors, {method}')
ax[0].set_xticks(np.arange(minNoll,maxNoll,step=2))
ax[1].set_xticks(np.arange(minNoll,maxNoll,step=2))
ax[1].legend()
<matplotlib.legend.Legend at 0x7ff035fbe290>
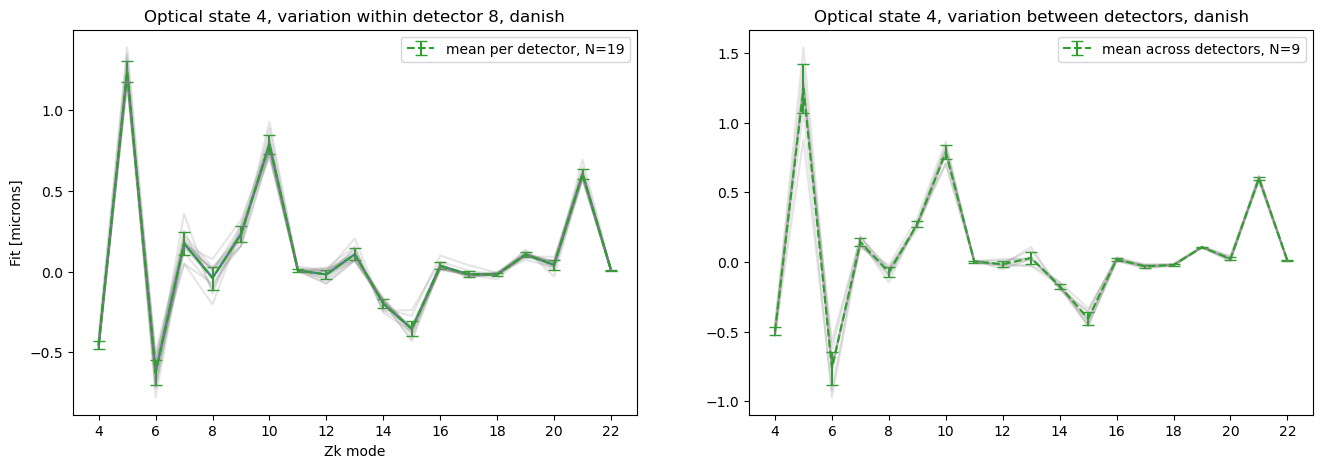
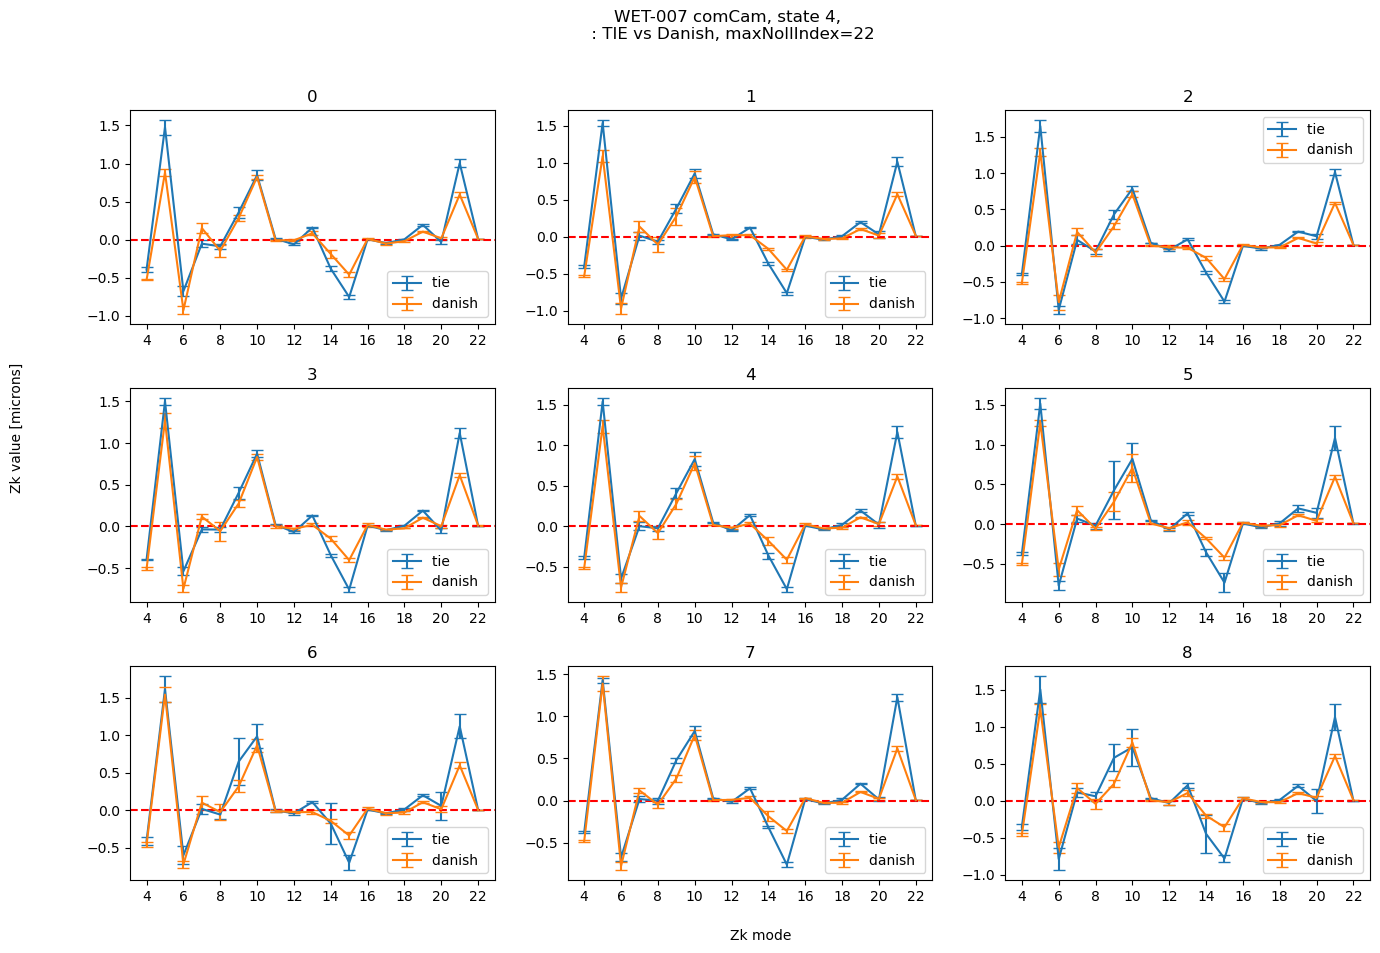
We plot that for all detectors for a single state, to show that the two methods have yield very similar results:
def plot_fit_errorbar(state, results, maxNollIndex):
    fig,axs = plt.subplots(3,3,figsize=(16,10))
    ax = np.ravel(axs)

    colors = {'danish':'green',  'tie':'orange'}
    for i in range(9):

        ax[i].set_title(i )
        detId=i
        for method in results.keys():
            # plot  averaged zks for danish and tie
            zkAvg = results[method][state][detId]['zernikeEstimateAvg'][0]
            zkRaw = results[method][state][detId]['zernikeEstimateRaw']
            zks = results[method][state][detId]['zernikes']
            mask_used = zks['used'][1:]
            zkr_used = zkRaw[mask_used]
            minNoll = 4
            maxNoll = minNoll + len(zkAvg)
            ax[i].errorbar(np.arange(minNoll, maxNoll), zkAvg, yerr=np.std(zkr_used, axis=0),
                          label=f'{method} ', capsize=4)

        ax[i].set_xticks(np.arange(minNoll, maxNoll, step=2))
        ax[i].axhline(0,ls='--', c='red')
        ax[i].legend()

    fig.text(0.5,0.05, 'Zk mode')
    fig.text(0.05,0.5, 'Zk value [microns]', rotation='vertical')
    fig.subplots_adjust(hspace=0.3)
    fig.suptitle(f'WET-007 comCam, state {state}, \n : TIE vs Danish, maxNollIndex={maxNollIndex}')
maxNollIndex = 22
plot_fit_errorbar(1, results_stored[maxNollIndex], maxNollIndex, )
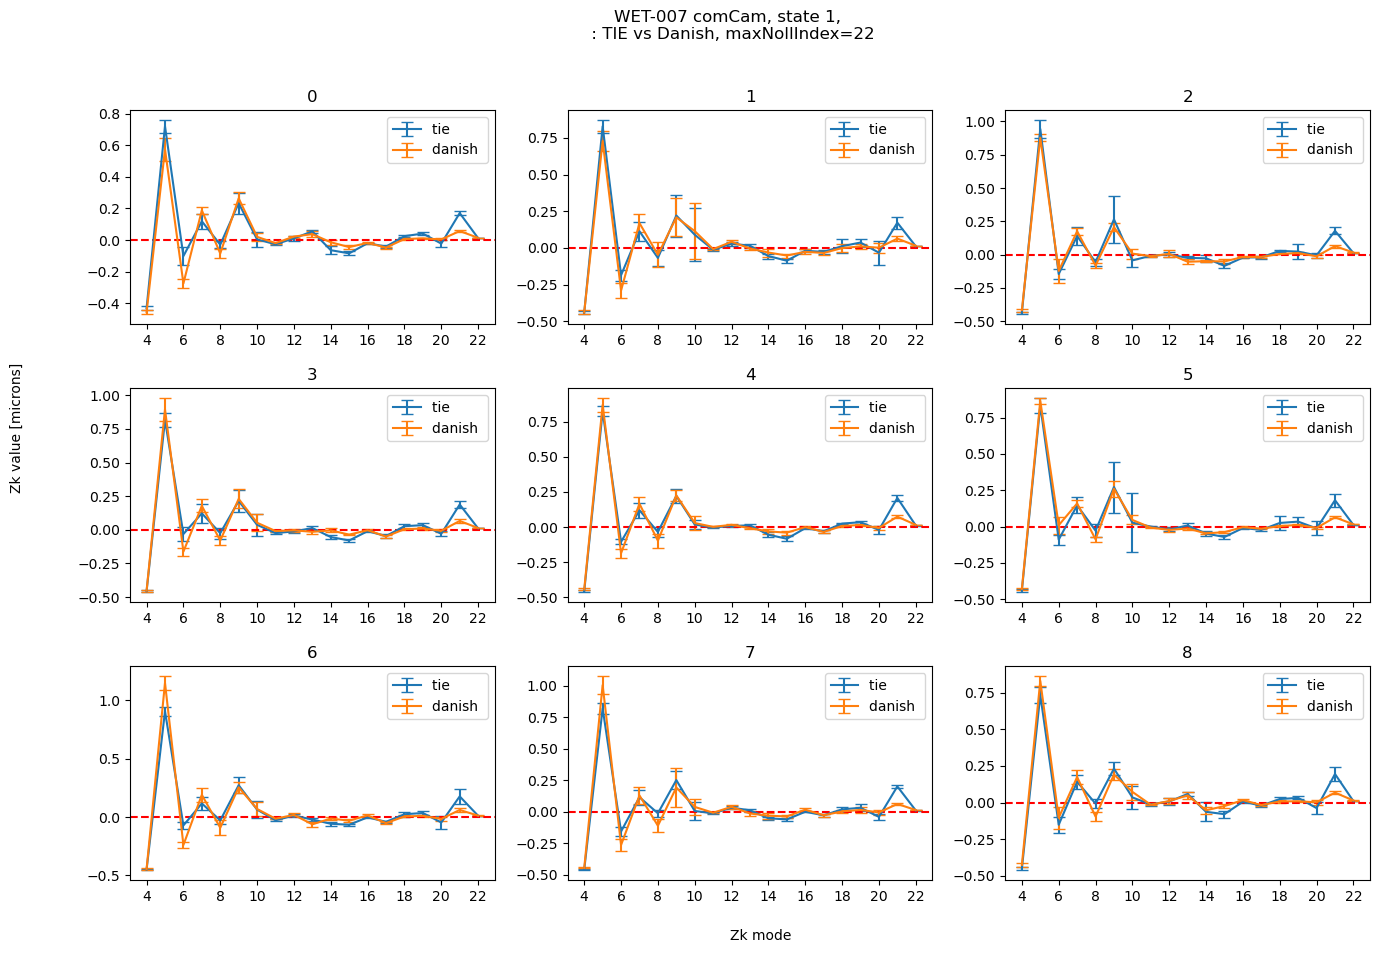
Illustrate the difference between the two methods:
def plot_diff(state, results, maxNollIndex):
    fig,axs = plt.subplots(3,3,figsize=(16,10))
    ax = np.ravel(axs)

    # this plots  just the pairing results
    colors = {'danish':'green',  'tie':'orange'}
    for i in range(9):
        detId = i
        ax[i].set_title(detId)

        # plot  difference between danish and tie
        zk1 = results['danish'][state][detId]['zernikeEstimateAvg'][0]
        zk2 = results['tie'][state][detId]['zernikeEstimateAvg'][0]
        minNoll = 4
        maxNoll = minNoll + len(zk1)
        ax[i].plot(np.arange(minNoll, maxNoll),zk1-zk2, marker='d', )
        ax[i].set_xticks(np.arange(minNoll, maxNoll,step=2))
        ax[i].axhline(0,ls='--', c='red')

    fig.text(0.5,0.05, 'Zk mode')
    fig.text(0.05,0.5, f'$\Delta$ zk fit (Danish-TIE) [microns]', rotation='vertical')
    fig.subplots_adjust(hspace=0.3)
    fig.suptitle(f'WET-007 comCam, state {state}, \n : TIE vs Danish, maxNollIndex={maxNollIndex}')
maxNollIndex = 22
plot_diff(2, results_stored[maxNollIndex], maxNollIndex)
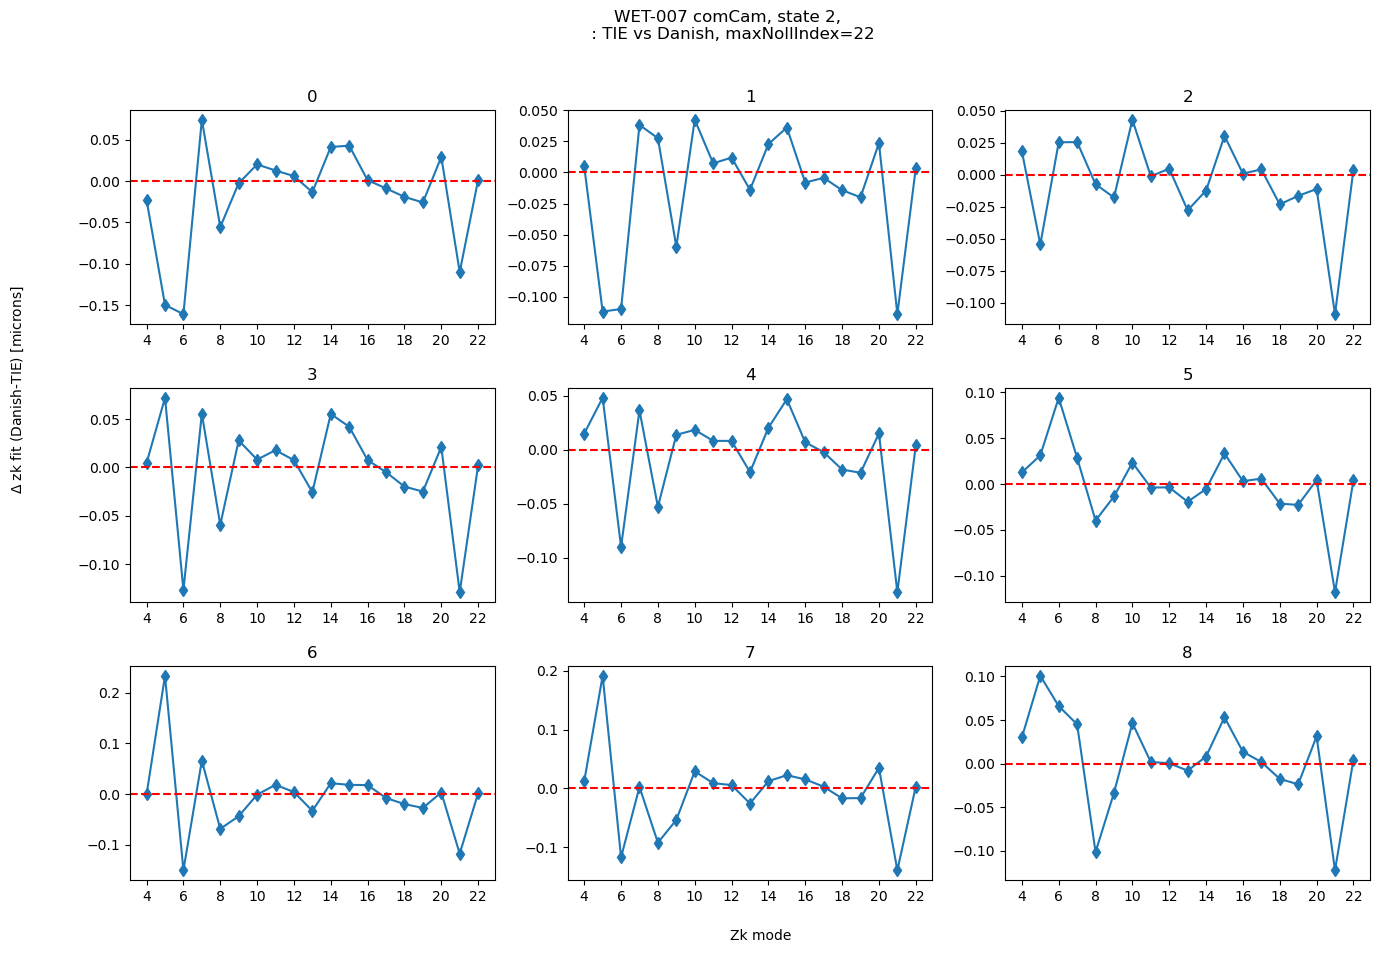
We can also test eg. how does the difference in a single mode, such as astigmatism (Noll Zk5,6), compare between two fitting methods across a variety of simulated optical states:
maxNollIndex = 22
results = results_stored[maxNollIndex]

minNoll = 4

fig,axs = plt.subplots(3,3,figsize=(16,10))
ax = np.ravel(axs)

for measNoll in [5,6]: # oblique and vertical astigmatism
    measIndex = measNoll - minNoll
    for i in range(9):
        detId = i
        ax[i].set_title(detId)

        diffs = []
        states = []
        for state in range(1,101):
            cond1 = len(results['danish'][state][detId])>1
            cond2 = len(results['tie'][state][detId])>1
            if cond1 and cond2 :

                # plot  difference for danish and tie
                zk1 = results['danish'][state][detId]['zernikeEstimateAvg'][0][measIndex]
                zk2 = results['tie'][state][detId]['zernikeEstimateAvg'][0][measIndex]
                diffPerMode = zk1-zk2

                diffs.append(diffPerMode)
                states.append(state)
        # x: all states ;  y: difference per mode
        ax[i].plot(states, diffs,  marker='d', label=r'$\Delta$'+f'Zk{measNoll}')
for i in range(9):
    ax[i].axhline(0,ls='--', c='red')
    ax[i].set_ylim(-.5,.5)
    ax[i].legend()

fig.text(0.5,0.05, 'state #', fontsize=17)
fig.text(0.05,0.5, f'$\Delta$ Zk5,6 (Danish-TIE) [microns]', rotation='vertical', fontsize=17)
fig.subplots_adjust(hspace=0.3)
fig.suptitle(f'WET-007 comCam simulation, \n TIE vs Danish, primary astigmatism (zk5 and 6),  maxNollIndex={maxNollIndex}')
Text(0.5, 0.98, 'WET-007 comCam, \n TIE vs Danish, Zk6 only, maxNollIndex=22')
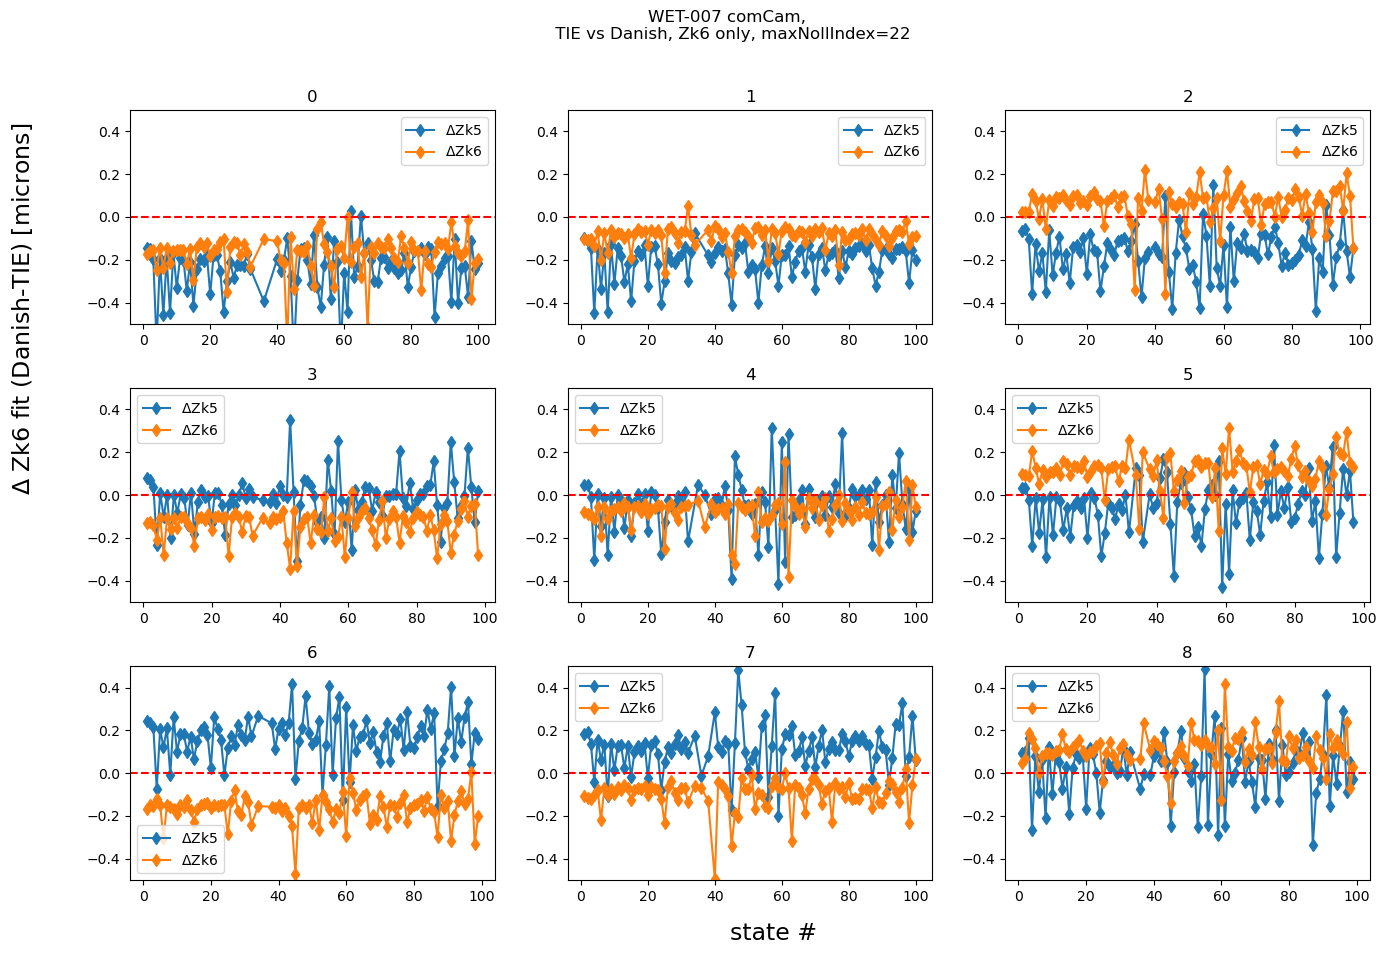
This shows that when there is a disagreement in astigmatism, it would be the opposite sign for the conjugate component (eg. for detector 6, all Danish fits give larger value to Zk5 than TIE, and for Zk6 it is reversed - all Danish fits result in a smaller Zk6 than TIE).
Compare all modes across optical states#
Calculate the RMS difference between TIE and Danish per detector per state:
def calc_rms_diff(results):

    rmss={}
    states = {}
    rmserrDanish = {}
    rmserrTie = {}

    sumErrDanish  = {}
    sumErrTie = {}
    for raft in range(9):
       rmss[raft] = []
       states[raft] = []
       rmserrDanish[raft] = []
       rmserrTie[raft] = []
       sumErrDanish[raft] = []
       sumErrTie[raft]=[]
       for state in range(1,101):
            #print(raft, state)
            cond1 = len(results['danish'][state][raft])>1
            cond2 = len(results['tie'][state][raft])>1
            if cond1 and cond2 :
                # calculate RMS difference between two estimates of Zk fits
                zk1 = results['danish'][state][raft]['zernikeEstimateAvg'][0]
                zk2 = results['tie'][state][raft]['zernikeEstimateAvg'][0]
                rms_diff =  np.sqrt(np.mean(np.square(zk1-zk2)))
                rmss[raft].append(rms_diff)
                states[raft].append(state)

                # calculate RMS of uncertainties
                for method, rmsDict, sumDict in zip(['danish', 'tie'],
                                           [rmserrDanish, rmserrTie],
                                            [sumErrDanish, sumErrTie]
                                          ):
                    zkRaw = results[method][state][raft]['zernikeEstimateRaw']
                    zks = results[method][state][raft]['zernikes']
                    mask_used = zks['used'][1:]
                    zkr_used = zkRaw[mask_used]
                    zkErr = np.std(zkr_used, axis=0) # uncertainty per Zk mode
                    rmsErr = np.sqrt(np.mean(np.square(zkErr))) # single number
                    rmsDict[raft].append(rmsErr)
                    sumDict[raft].append(np.sqrt(np.sum(np.square(zkErr))))

                if rms_diff > 10:
                    print(method, raft, state, rms_diff)
    return rmss, states, rmserrDanish, rmserrTie, sumErrDanish, sumErrTie
The total error per detector per state is the sum of variances. This is done for Danish and TIE:
maxNollIndex = 22
rmss, states, rmserrDanish, rmserrTie, sumErrDanish, sumErrTie =  calc_rms_diff(results_stored[maxNollIndex])

fig,axs = plt.subplots(3,3,figsize=(20,13))
ax = np.ravel(axs)

for raft in range(9):
    ax[raft].plot(states[raft], rmss[raft], marker='s', label=r'$\Delta$ RMS')
    ax[raft].plot(states[raft], sumErrDanish[raft], label=r'$\sigma_{ttl}$ Danish')
    ax[raft].plot(states[raft], sumErrTie[raft], label=r'$\sigma_{ttl}$ TIE')
    ax[raft].set_title(raft)
    ax[raft].set_ylim(0,0.5)

fig.text(0.5,0.06,'state #', fontsize=17)
fig.text(0.06,0.5,r'RMS ($\Delta$(zk Danish - zk TIE ) ) [microns] ', rotation=90, fontsize=17)
fig.suptitle('CWFS methods, maxNollIndex:22', fontsize=16)
ax[2].legend(bbox_to_anchor=[0.55,.6])
<matplotlib.legend.Legend at 0x7ff036d44610>
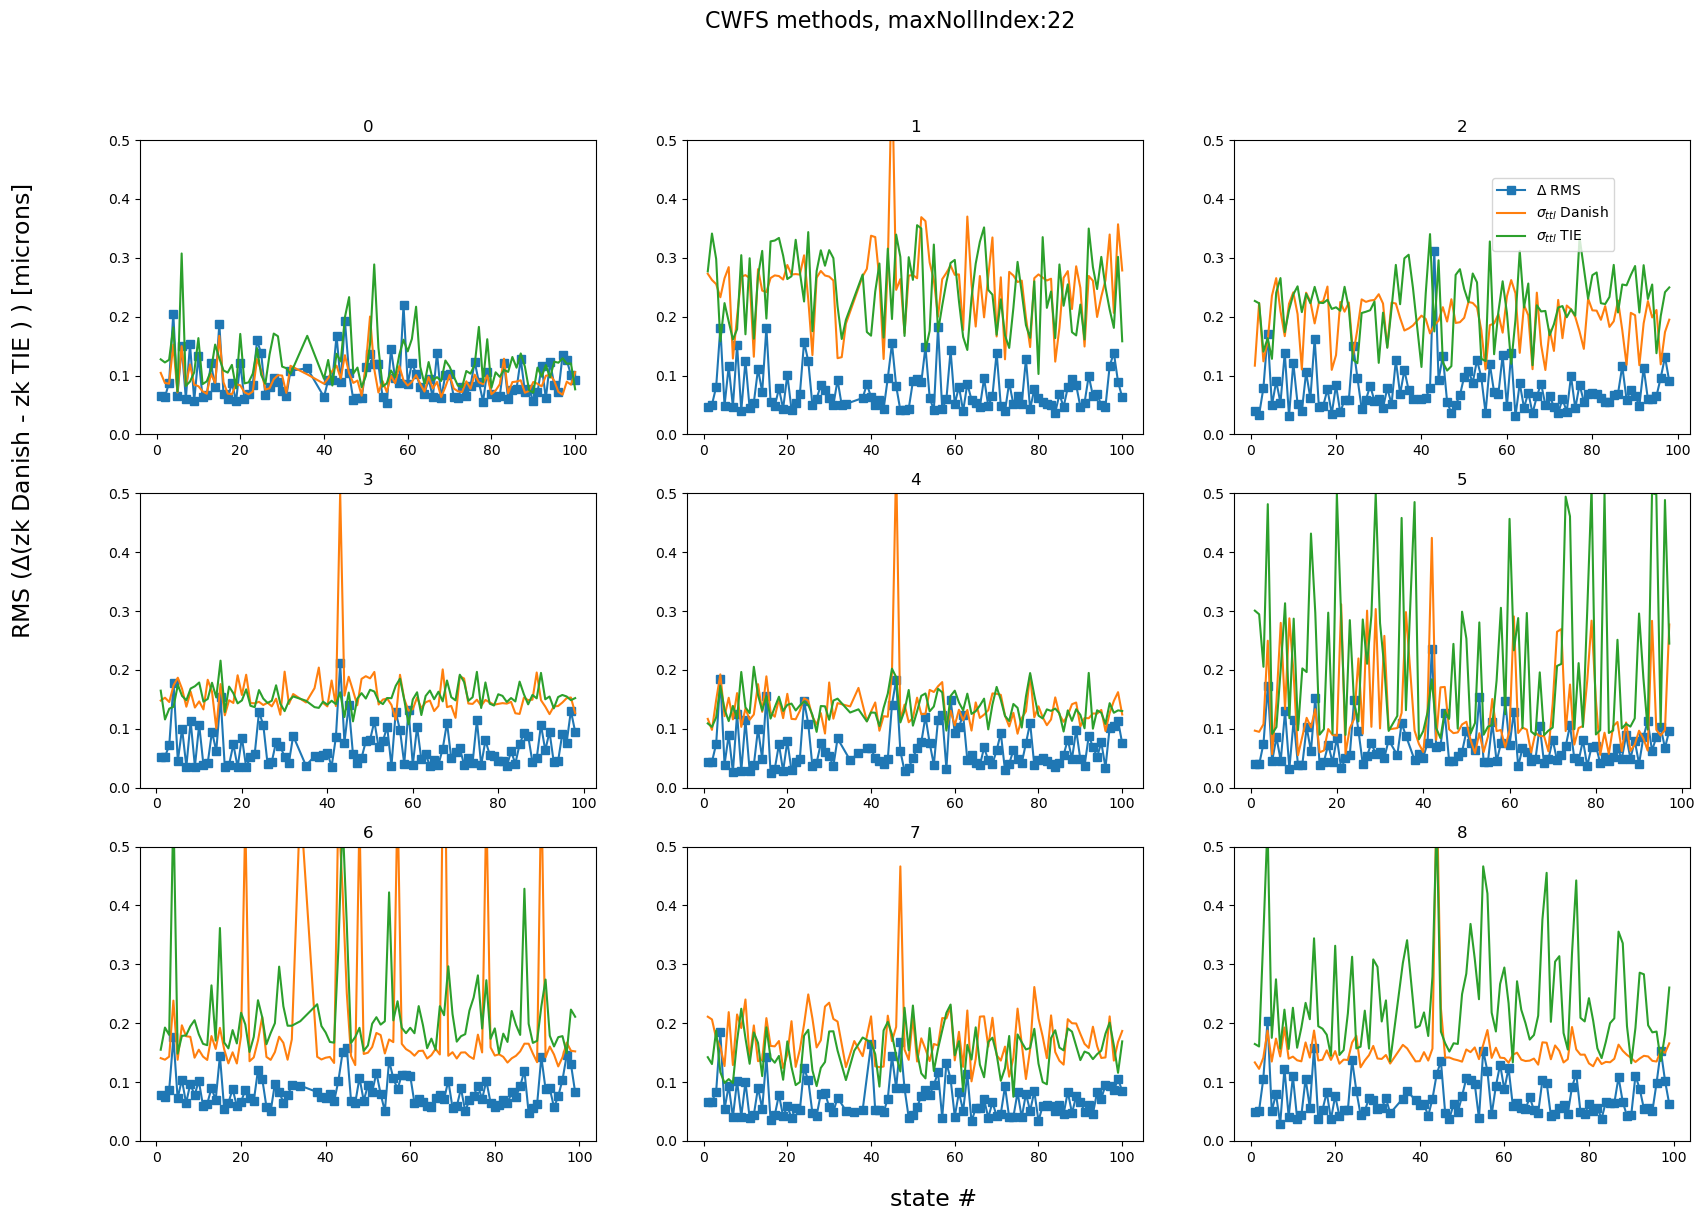
This means that the RMS difference between TIE and Danish is overall less than the combined variances. The difference between TIE and Danish is larger when using maxNollIndex of 29:
maxNollIndex= 29
rmss, states, rmserrDanish, rmserrTie, sumErrDanish, sumErrTie =  calc_rms_diff(results_stored[maxNollIndex])
fig,axs = plt.subplots(3,3,figsize=(20,13))
ax = np.ravel(axs)

for raft in range(9):
    ax[raft].plot(states[raft], rmss[raft], marker='s', label=r'$\Delta$ RMS')
    ax[raft].plot(states[raft], sumErrDanish[raft], label=r'$\sigma_{ttl}$ Danish')
    ax[raft].plot(states[raft], sumErrTie[raft], label=r'$\sigma_{ttl}$ TIE')
    ax[raft].set_title(raft)
    ax[raft].set_ylim(-0.1,1.5)

fig.text(0.5,0.06,'state #', fontsize=17)
fig.text(0.06,0.5,r'RMS ($\Delta$(zk Danish - zk TIE ) ) [microns] ', rotation=90, fontsize=17)
fig.suptitle('CWFS methods', fontsize=16)
ax[2].legend(bbox_to_anchor=[0.55,.6])
tie 1 45 608.7696423542536
<matplotlib.legend.Legend at 0x7ff02a820dd0>
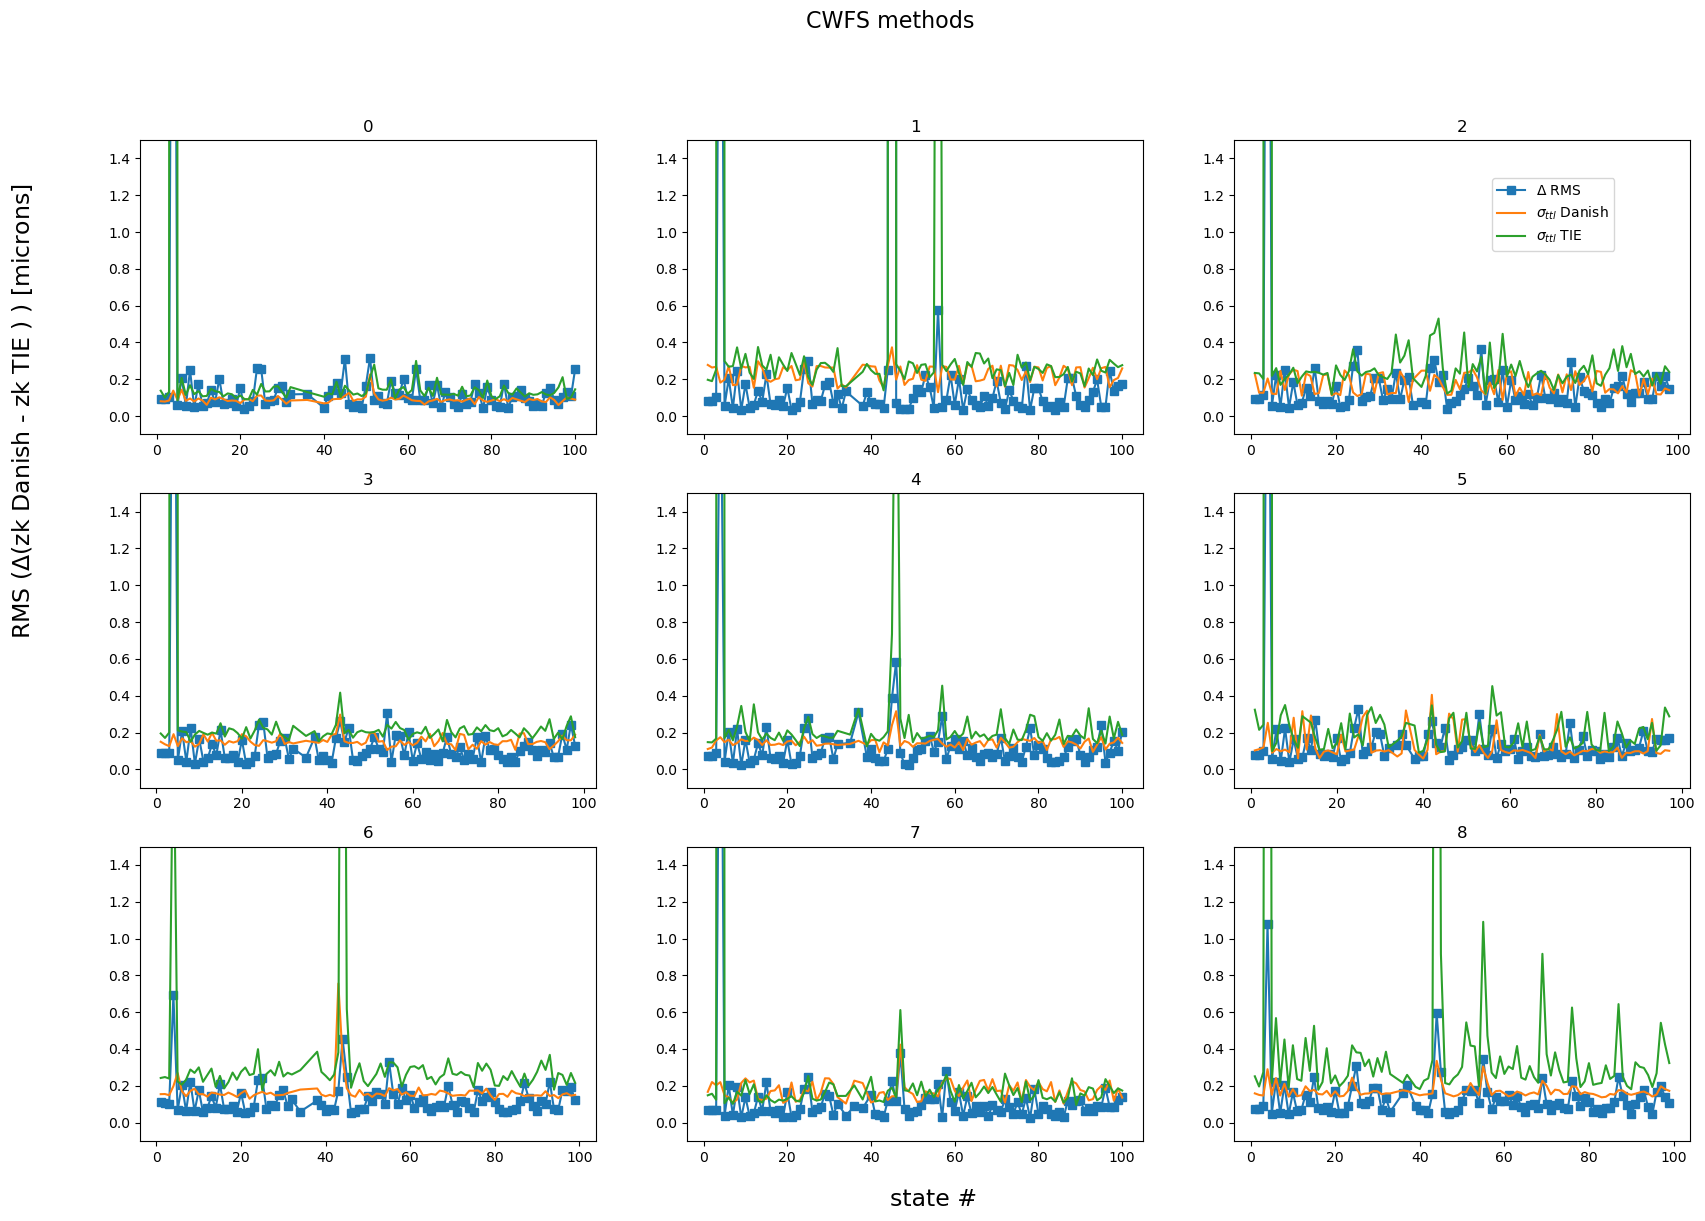
For most simulated states, the agreement is at 0.1 microns rms. Those which have a large TIE error (that also corresponds to largest difference in fit results), also correspond to cases where maxNollIndex=29 leads to unconstrained fit (i.e. fit stops at max iterations, and not because it converged). This situation is not seen with maxNollIndex=22.
Plot in detail that state: with zk22 as max TIE is much better behaved than with zk28.
maxNollIndex = 22
plot_fit_errorbar(4, results_stored[maxNollIndex], maxNollIndex, )
maxNollIndex = 29
plot_fit_errorbar(4, results_stored[maxNollIndex], maxNollIndex, )
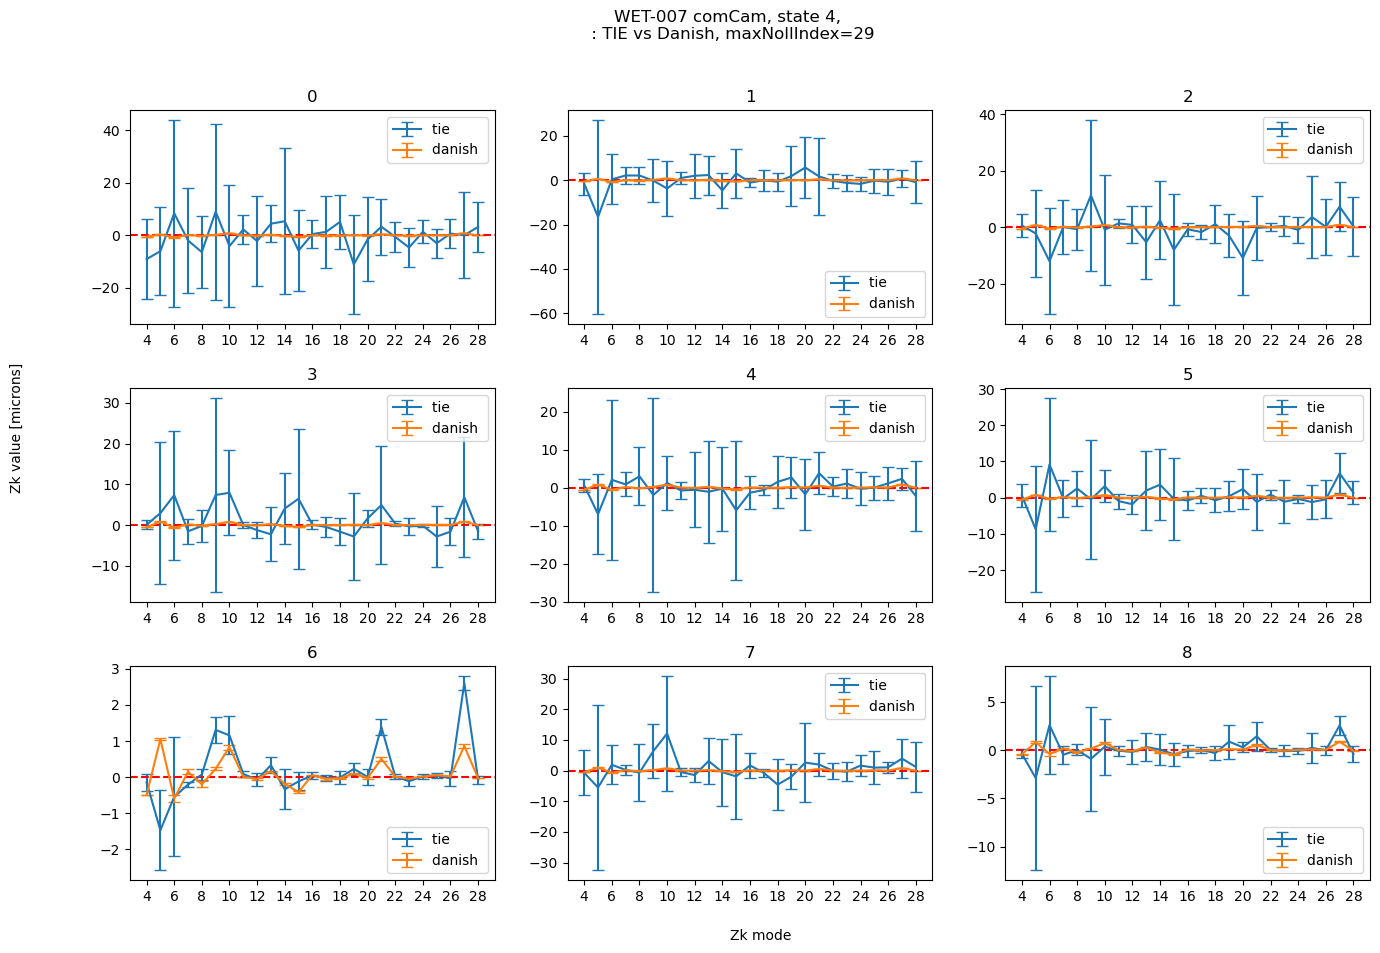
In summary, based on the simulation of 100 random optical states fitted with either Danish or TIE, exploring the fit of Z4:22 or Z4:29. We find that across all states the RMS difference across all modes between Danish and TIE is < 0.1 microns. Danish performs well even with larger amount of allowed Zk modes, TIE suffers from unstable behavior, especially when adding Zk 23-26.